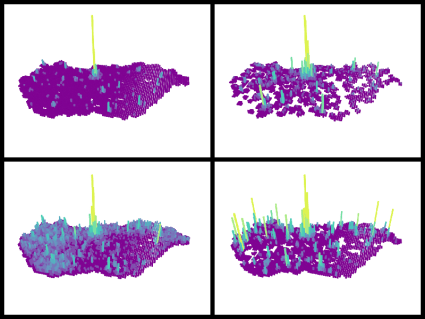
Overpass API is an incredible data source. We used pydeck and Blender to visualize the frequency of various OSM features (aka categories) in Hungary.
(more…)Category: visualization
-
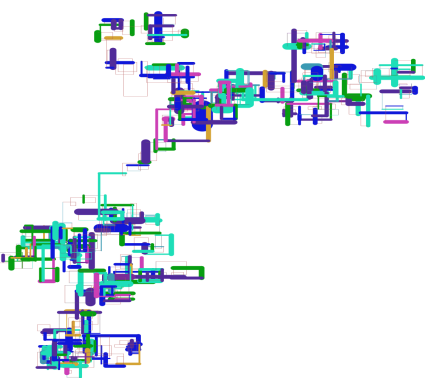
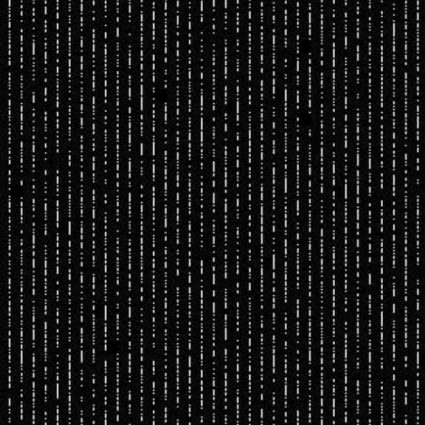
Text visualization – some simple exercises
Visualizing text is neither easy, nor a straightforward task and often it is totally useless. Here, we try to give a visual summary of various texts and the question if any of the visualizations is useful left to the reader. Woody Allen’s bon mot, “I took a speed-reading course and read War and Peace in twenty minutes. It involves Russia.” serves as our disclaimer here.
(more…) -
Choose a printed visualization from our shop
-
The marriage of artificial intelligence and art
Who has not ever wondered about the interplay between art and artificial intelligence? Here we share our thoughts on how art can help us to shed light on various aspects of scientific knowledge, how cognitive science serves as a bridge between art and science, and what the limitations of visualization techniques are.
(more…) -
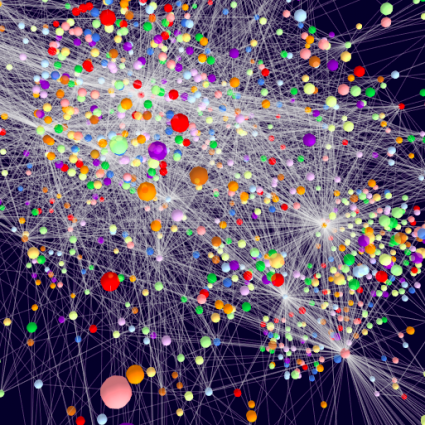
How babies acquire their first words. From babbling to talking.
Language acquisition is one of the greatest mysteries of life. It takes only a few months to master one of the most complex phenomena in the world. Using the CHILDES database, we made an animated visualization of this process regarding English.
(more…)