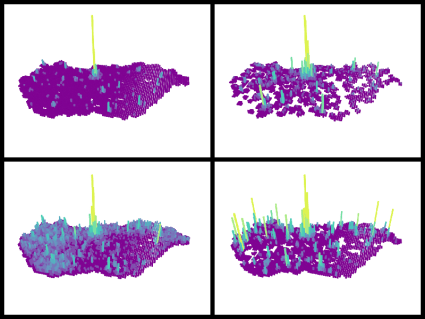
Overpass API is an incredible data source. We used pydeck and Blender to visualize the frequency of various OSM features (aka categories) in Hungary.
overpy is a nice package which let you query the Overpass API. First, we aggregated the data on a grid and used Blender to build a 3D mesh. Since we are JavaScript dummies, we used Babylon.js to embed the mesh into a simple HTML page.

We are into geospatial search. Uber’s h3 library is a handy geoindexing tool that is using a hexagonal grid system. We wanted to make an interactive map that shows the aggregated data on a hexagonal grid. Deck.gl developers made us green with envy, but we found pydeck so now we can make interactive deck.gl-based maps too. We were luck, we could achieve our goal using only Python 😀
Stay tuned, more to come soon!
Stand-alone versions of the vizs can be found here.
Make a one-time donation
Make a monthly donation
Make a yearly donation
Choose an amount
Or enter a custom amount
Your contribution is appreciated.
Your contribution is appreciated.
Your contribution is appreciated.
Do you like our visualizations? Buy them for yourself!
Visit our shop on Society6 to get a printout of our vizs.


This work is licensed under a Creative Commons Attribution-NonCommercial-ShareAlike 4.0 International License.
This work is licensed under a Creative Commons Attribution-NonCommercial-ShareAlike 4.0 International License.