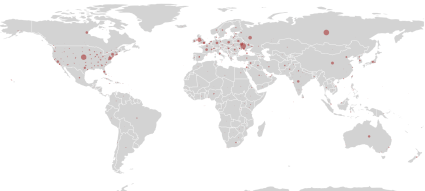
2022 is a busy year. The end of Q1 is coming closer and we still have the coronavirus pandemic, the Winter Olympic has just ended and Russia invaded Ukraine. We used the GDELT database to visualize which geolocations were mentioned in the global media during the first quarter of this year.
(more…)Tag: Python
-
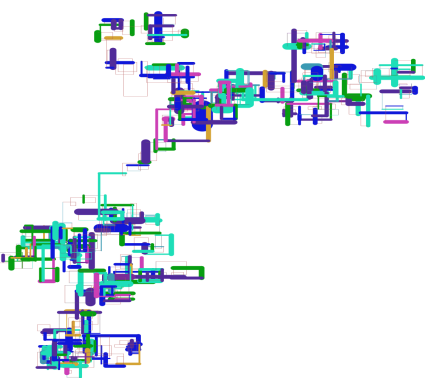
Text visualization – some simple exercises
Visualizing text is neither easy, nor a straightforward task and often it is totally useless. Here, we try to give a visual summary of various texts and the question if any of the visualizations is useful left to the reader. Woody Allen’s bon mot, “I took a speed-reading course and read War and Peace in twenty minutes. It involves Russia.” serves as our disclaimer here.
(more…) -
Software engineering for data scientists Part 2 – automate your life
Let’s face it, data scientists work with software engineers and at the end of the day, they have to deploy software. An effective data scientists should be able to work within a software development team, so (s)he must be able to use the tools of the trade. Our previous post introduced the very basics and now we make a further step.
(more…) -
Using AI to Predict Risk in Public Procurement
Our report on using AI to predict the riskiness of public procurement calls based on their text is available on tenders.guru
(more…) -

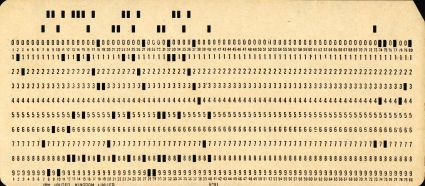
Software engineering for data scientists – Part 1, Development Tools
I have bad news; being able to write programs is only a tiny fraction of software development and data science. You have to know a lot of things and this can become very frustrating. You will be bombarded with acronyms and silly-named tools, like IDE, git, version control, CI, etc, etc. At some point, you have to start use the tools of the trade along with coding and here we give you some advice on what to use to become a pro.
(more…)